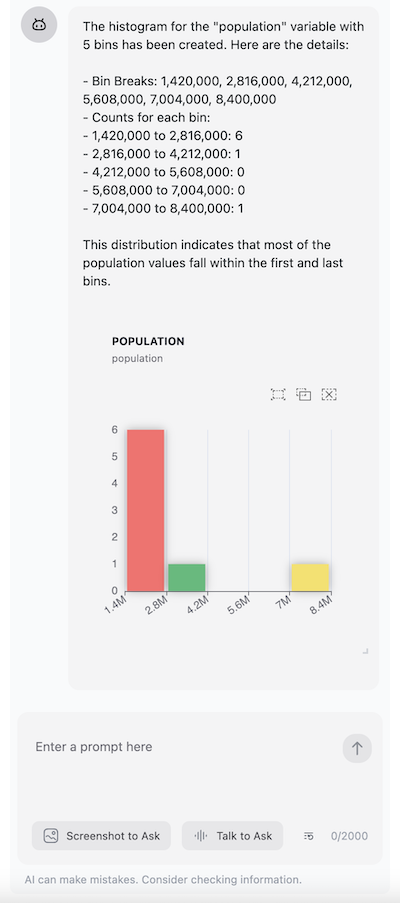
Plot Plugin using ECharts
The ECharts plugin for OpenAssistant provides powerful visualization capabilities using Apache ECharts. This tutorial will guide you through setting up and using the plugin in your application.

Features
The plugin currently supports two main visualization types:
-
Histogram Plots - Visualize data distribution with features like:
- Customizable number of bins
- Interactive bar selection
- Light/dark theme support
- Automatic bin calculation
- Tooltip with bin information
-
Scatter Plots - Visualize relationships between variables with features like:
- Interactive point selection
- Regression line support
- LOESS smoothing option
- Statistical information display
- Brush selection tools
Installation
Install the package using npm or yarn:
npm install @openassistant/echarts
or
yarn add @openassistant/echarts
Setup Guide
1. Basic Setup
First, ensure you have OpenAssistant set up in your application:
import { AiAssistant } from '@openassistant/ui';
// only for React app without tailwindcss
import '@openassistant/ui/dist/index.css';

const assistantProps = {
  name: 'My AI Assistant',
  description: 'This is my AI assistant',
  version: '1.0.0',
  modelProvider: 'openai',
  model: 'gpt-4',
  apiKey: 'your-api-key',
  instructions: `You are a data visualization assistant. You can help users create histograms and scatter plots from their datasets.`,
};
2. Share Dataset Metadata
The assistant needs to understand your data structure. Share metadata about your datasets:
const myDataContext = [
  {
    description: 'Please use the following meta data for function callings.',
    metaData: [{
      datasetName: 'myVenues',
      fields: ['location', 'latitude', 'longitude', 'revenue', 'population'],
    }]
  },
];

// Add metadata to the assistant
const { addAdditionalContext } = useAssistant(assistantProps);
addAdditionalContext({ context: JSON.stringify(myDataContext) });
3. Register Visualization Functions
Import and register the visualization functions:
import {
  histogramFunctionDefinition,
  scatterplotFunctionDefinition,
} from '@openassistant/echarts';

const myFunctions = [
  histogramFunctionDefinition({
    getValues: (datasetName: string, variableName: string) => {
      return getValuesFromMyDatasets(datasetName, variableName);
    },
  }),
  scatterplotFunctionDefinition({
    getValues: async (
      datasetName: string,
      xVariableName: string,
      yVariableName: string
    ) => {
      return getXYValuesFromMyDatasets(datasetName, xVariableName, yVariableName);
    },
  }),
];

// Add functions to assistant props
const assistantProps = {
  // ... other props ...
  functions: myFunctions,
};
4. Implement Data Retrieval
Create functions to fetch your data:
async function getValuesFromMyDatasets(datasetName: string, variableName: string): Promise<number[]> {
  const dataset = myDatasets[datasetName];
  return dataset.map((item) => item[variableName]);
}

async function getXYValuesFromMyDatasets(
  datasetName: string,
  xVar: string,
  yVar: string
): Promise<{
  x: number[];
  y: number[];
}> {
  const dataset = myDatasets[datasetName];
  return {
    x: dataset.map((item) => item[xVar]),
    y: dataset.map((item) => item[yVar]),
  };
}
Using with TailwindCSS
If your project uses TailwindCSS, update your configuration:
/** @type {import('tailwindcss').Config} */
module.exports = {
  content: [
    './src/**/*.{js,ts,jsx,tsx}',
    '../../node_modules/@nextui-org/theme/dist/**/*.{js,ts,jsx,tsx}',
    '../../node_modules/@openassistant/echarts/dist/**/*.{js,ts,jsx,tsx}',
  ],
  theme: {
    extend: {},
  },
  darkMode: 'class',
  plugins: [nextui()],
};
Usage Examples
Once set up, you can create visualizations through natural language prompts:
- For histograms: "Create a histogram of the 'revenue' variable"
- For scatter plots: "Show me a scatter plot of revenue vs population"
The assistant will automatically understand your request and use the appropriate visualization function.
Coming Soon
We're actively working on expanding our visualization capabilities with new chart types:
- 📊 Box plots
- 📈 Dynamic line charts
- 📊 Interactive bar charts
- 🥧 Parallel coordinates
- And more!